One number, five lifts.
The Strength Score is a coaching number from 0 to 999, built from estimated one-rep maxes on five compound lifts and scaled to your bodyweight. This page documents the pipeline — what goes in, how it is weighed, and what the number cannot tell you.
Written and maintained by Alex Tirim, founder of RepStack. This is the formula that ships in the app — the same code path, not a marketing version. Published June 10, 2026.
The answer
Five lifts, each scored 0–200 against your bodyweight.
The Strength Score is a number from 0 to 999 that summarizes how strong your training log says you are, relative to your bodyweight, across five compound lift families: bench press, squat, deadlift, overhead press, and row. Each family earns a sub-score from 0 to 200 based on your estimated one-rep max. The five sub-scores are averaged and multiplied by 5 — that is the whole top-level formula. A score of 612 means your five lifts average just past the Advanced line.
It is a coaching metric computed from sets you logged yourself. It has not been validated against tested one-rep maxes, it is not a percentile ranking against other lifters, and it cannot see your form. We publish the formula anyway, because a score you cannot inspect is a score you cannot argue with.
Foundation
0–199
Novice
200–399
Intermediate
400–599
Advanced
600–799
Elite
800–999
The five tiers. The names are bands on the same 0–999 scale, not separate tests.
The pipeline
From a logged set to a score, in four steps.
-
1
Your best set becomes an estimated 1RM
Every logged set runs through the Epley equation: e1RM = weight × (1 + reps ÷ 30). A set of 100 kg x 8 estimates a 126.7 kg max. A single at 140 kg counts as 140 kg. The best estimate per lift family is the one that scores.
-
2
Each estimate is matched to one of five lift families
Bench, squat, deadlift, overhead press, row. The matcher prefers barbell variations; if you have logged none, it falls back to dumbbell and kettlebell work, then to machine and cable work — and discounts the fallbacks (the table below shows how much).
-
3
The estimate is divided by your bodyweight
Everything converts to kilograms first, so the unit setting never changes the score. The e1RM-to-bodyweight ratio is then placed on a calibrated 0–200 scale per lift, with straight-line interpolation between the threshold points.
-
4
Five sub-scores average into one number
The mean of the five 0–200 sub-scores, multiplied by 5 and capped at 999, is your Strength Score. A lift you have never logged does not score zero: until real sets exist, the app fills the gap with a starting estimate based on your stated experience level, and replaces it the moment you log the real thing.
The bench press scale, as shipped
Ratio is e1RM divided by bodyweight, both in kilograms. The example column assumes an 80 kg lifter.
| Ratio | Sub-score | e1RM at 80 kg bodyweight |
|---|---|---|
| 0.50 | 0 | 40 kg |
| 0.75 | 50 | 60 kg |
| 1.25 | 100 | 100 kg |
| 1.75 | 150 | 140 kg |
| 2.25 | 200 | 180 kg |
The other four lifts have their own threshold tables, calibrated per movement — a 2.0x bodyweight deadlift and a 2.0x bodyweight bench are not the same achievement, and the scales reflect that. The full 25-number matrix is the one part of the formula we keep in the app rather than on this page: it is calibration we revise as logged training data accumulates, and it versions with the code. When it changes, this page gets a visible update note.
Worked example
An 80 kg lifter, five logged sets, one score.
Take an 80 kg lifter whose best recent sets are the five below — all barbell lifts, so no tier discount applies. Run each through the pipeline and the score falls out:
Bench
85 kg x 6 → e1RM 102.0 kg
ratio 1.28 → sub-score 103
Squat
110 kg x 5 → e1RM 128.3 kg
ratio 1.60 → sub-score 85
Deadlift
140 kg x 4 → e1RM 158.7 kg
ratio 1.98 → sub-score 98
Overhead press
50 kg x 6 → e1RM 60.0 kg
ratio 0.75 → sub-score 90
Row
80 kg x 8 → e1RM 101.3 kg
ratio 1.27 → sub-score 133
The five sub-scores average 101.8; multiplied by 5, the Strength Score is 509 — Intermediate, 91 points below the Advanced line. Notice the row sub-score of 133 against the squat's 85: this lifter's pulling strength is ahead of their legs, and the per-lift breakdown says so before any coach would.
Equipment tiers
A leg press is not a squat, so it does not score like one.
Machine and dumbbell loads are not comparable to barbell loads. A 200 kg x 10 leg press estimates a 266.7 kg e1RM — taken at face value, that is a 3.33 ratio for our 80 kg lifter and a perfect 200 sub-score, "stronger" than a 2.5x bodyweight squatter. Nobody believes that, so the score does not either. When a lift family is filled by a fallback tier, the ratio is discounted before scoring:
Tier 1 — barbell
Barbell bench press, back squat, conventional deadlift. Full credit. Barbell loads are the most comparable across gyms.
×1.00
Tier 2 — dumbbell / kettlebell
Dumbbell bench press, goblet squat, one-arm row. Stabilizing two implements changes what a given load means.
×0.90
Tier 3 — machine / cable
Leg press, chest press machine, seated cable row. Sled angles and machine mechanics make the loads incomparable to free weights.
×0.70
With the ×0.70 discount, that leg press scores 139, not 200 — strong, but no longer pretending to be an elite squat. The discounts are calibration judgments, not physiological constants. They also explain the score's most confusing behavior: switch from barbell to dumbbell bench mid-program and your score can dip even while training goes well. That is the matcher changing tiers, not your strength leaving.
When the number lies
What the score cannot tell you.
In validation work on prediction equations, LeSuer and colleagues (1997) found predicted maxes correlated with tested maxes above r = 0.95 in the bench press, squat, and deadlift — and still missed by lift-specific margins. A 2020 systematic review by Grgic and colleagues found the tested 1RM itself is reliable but not identical between sessions. Both facts set the ceiling on how seriously any e1RM-based score — ours included — deserves to be taken:
It is an estimate of an estimate
Epley predicts a max you did not actually test. Prediction equations track tested maxes closely — correlations above 0.95 in LeSuer and colleagues' 1997 comparison — but they miss by lift-specific margins, and every equation in that study underestimated the deadlift. Past roughly 10 reps we treat the estimate as soft. That cutoff is our judgment call, not a study result.
Even a real 1RM is not a fixed truth
Test-retest research on the 1RM itself finds it reliable but not identical from one session to the next, and familiarization with the test matters. A score built on estimates of a moving target deserves to be read as a trend, not a verdict.
It cannot see your form
A half-rep at 100 kg outscores a paused, full-range rep at 95 kg. The log is self-reported, and the score trusts it completely. If your rep standard drifts, the score quietly inflates with it.
It trusts your bodyweight field
Every ratio divides by the bodyweight in Settings. If you last updated it 8 kg ago, all five sub-scores are computed against a fiction. Update bodyweight and the score recalculates the same day.
It is not a percentile
The score never claims you are stronger than some percentage of lifters. Our logs cannot support that claim honestly yet, so we do not make it. Other apps score the same lifts with different formulas and thresholds — if their number disagrees with ours, neither is lying. They are different rulers.
It is not a health measurement
The score is a coaching metric built from logged lifts and bodyweight. It is not a fitness age, an injury-risk screen, a recovery score, or medical information of any kind.
Design choices
Three decisions we would defend.
Ratios, not absolute load
A 60 kg lifter benching 90 kg and a 110 kg lifter benching 120 kg are not answered by the same number. Dividing by bodyweight makes the score mean the same thing at every size. The cost is honesty about the input: the score is only as current as your bodyweight field.
Five compound families, no isolation work
Bench, squat, deadlift, press, row cover a push, a squat, a hinge, an overhead, and a pull — and they are the most consistently logged loaded movements in real training logs. Curls are excluded on purpose: a score you can inflate with arm day is a score nobody should trust.
A 0–999 scale, not letter grades
Tiers alone would move a few times a year. A granular score moves when the bar does — add 2.5 kg to one lift and the number ticks up the same day. The score is built to make a normal month of training visible, because that is the month where most lifters quit.
In the app
The score screen is this page, computed live.
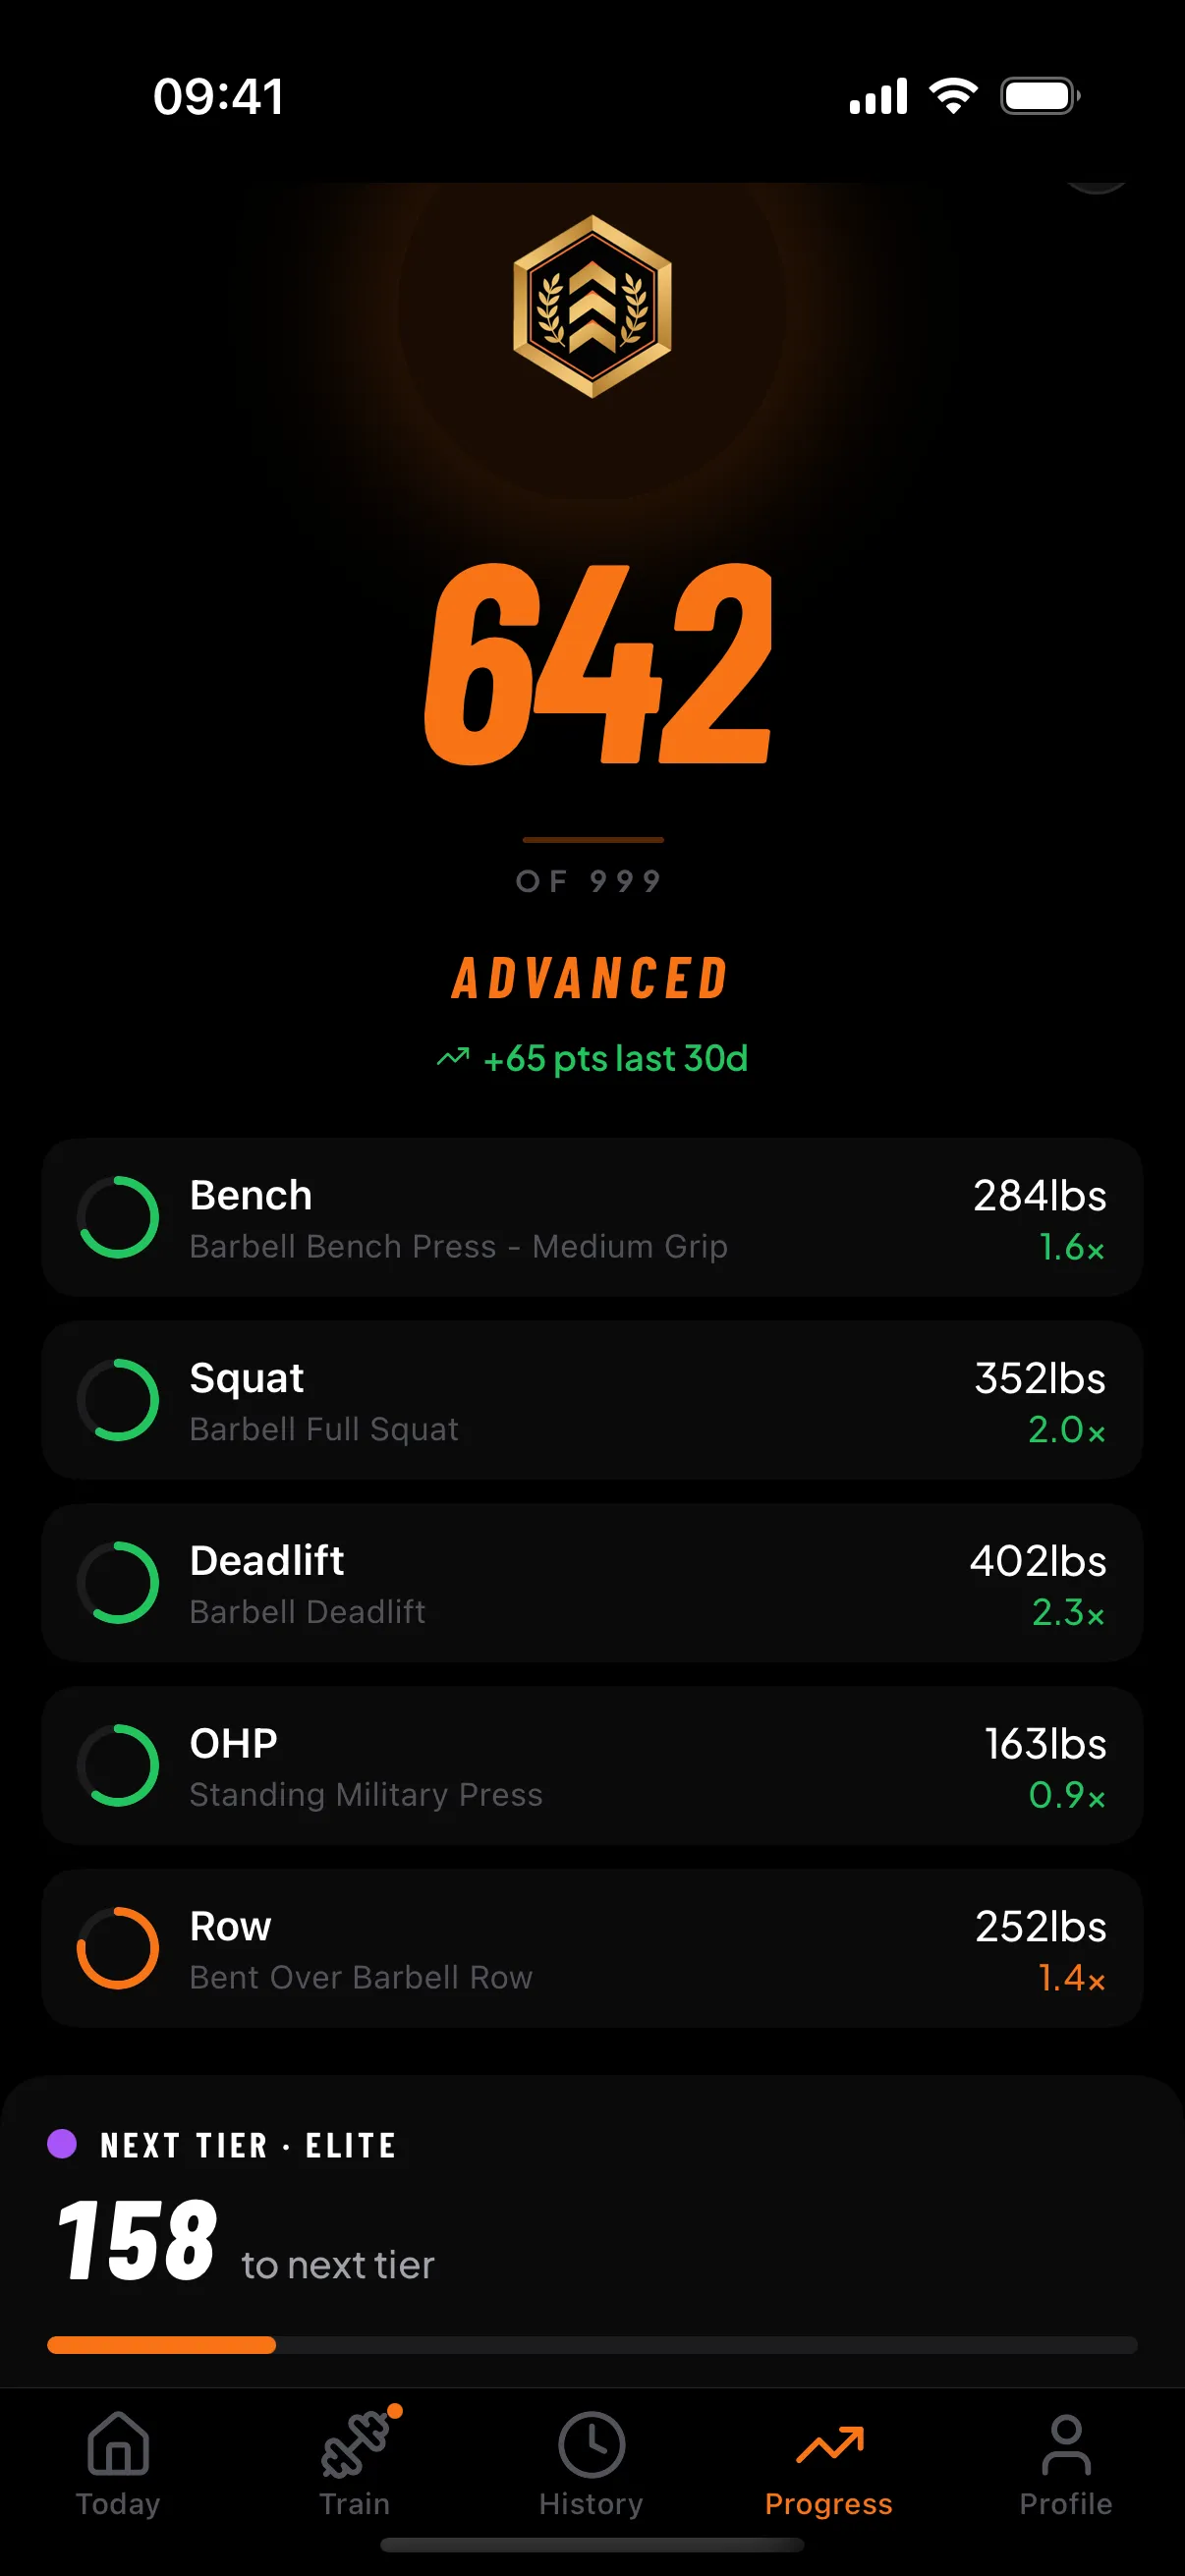
The same e1RM estimates feed the app's progression engine, so the score and your next-session targets always agree about how strong your log says you are. None of it is a diagnosis, a recovery score, or proof of a true max.
Logging is free on iOS. The Strength Score is part of RepStack Pro.
The bottom line
Read it as a trend, argue with it freely.
If the score climbs over months, your log says you are getting stronger for your size — that is all it says, and it is enough. If it dips the week you switch to dumbbells, read the tier table before you read anything into it. And if another app gives you a different number for the same lifts, neither app is wrong; you are looking at two rulers. Ours is the one published on this page, and when we change it, you will see the note here first.
Sources
What this page is based on.
The pipeline, thresholds, and discounts above are documented from RepStack's shipped scoring code — they are product methodology, not research findings. The studies below support the claims about what e1RM estimation can and cannot do.
- LeSuer et al. 1997 — accuracy of 1RM prediction equations in the bench press, squat, and deadlift
- Grgic et al. 2020 systematic review — test-retest reliability of the 1RM strength assessment
Spotted an error? Email [email protected]. Factual errors are corrected within 48 hours, with a visible note on this page.